WMI module
Download the module and
modify ROOT_WMIstub.ps1 - out of the box it lists just
the current server. You will probably want to add more from one of
the inventories. Contribute more on Github.
This module expects the Bell framework to run under an account
that has enough permissions to access other servers using WMI.
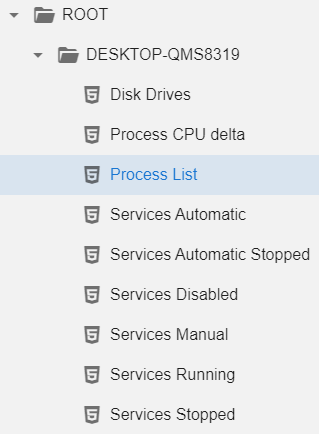
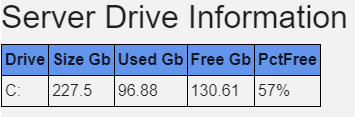
By default you see only the current server. For every server you can get information about disk drives:
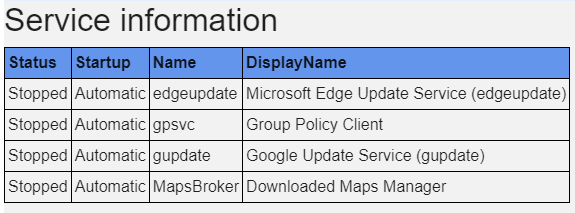
And information about services, filtered by the corresponding category:
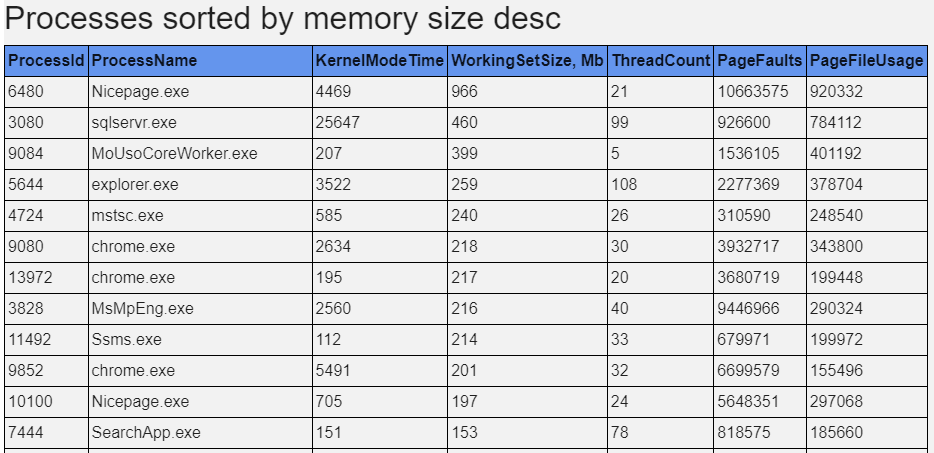
You can get a list of all the processes, sorted by memory in descending order:
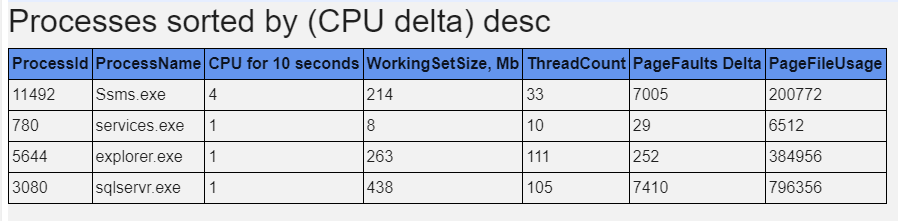
For CPU, use "Process CPU delta". In monitors processes for 10 seconds and calculates deltas in CPU and PageFaults. Note that the value "10 seconds" is 100% utilization of a single core, so it is much less than 100% of the machine, which typically has more than 1 core. Inactive processes are not included in the report.