Postgres
Download the module and
modify ROOT_PGstub.ps1 - out of the box it lists just
the current server. You will probably want to add more from one of
the inventories. When connection strings contain passwords, it is
recommended to write them in the following format: ###secretname###,
and the value for the secret is stored in config.js file and is
not sent to a client (and can not be debugged using F12-console).
Contribute more on Github.
Powershell uses ODBC to connect to Postgres, so you need to
have psqlodbc_ver-x64.zip
installed on a server.
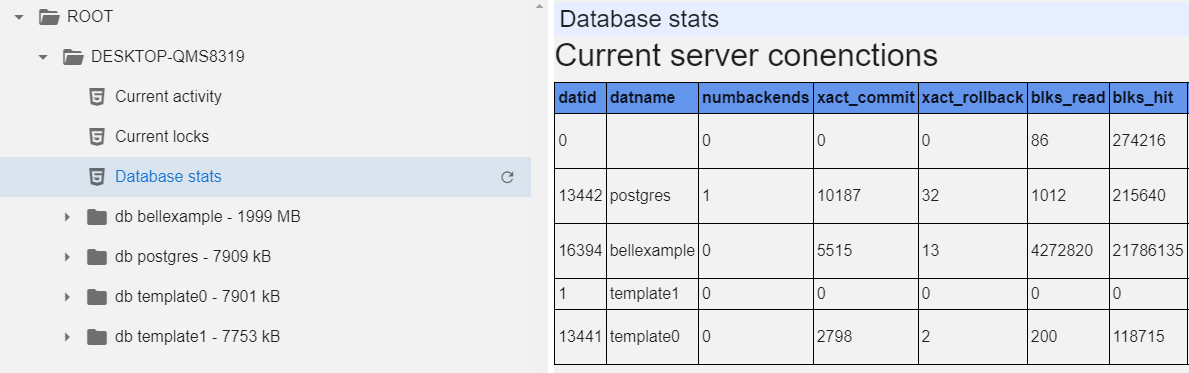
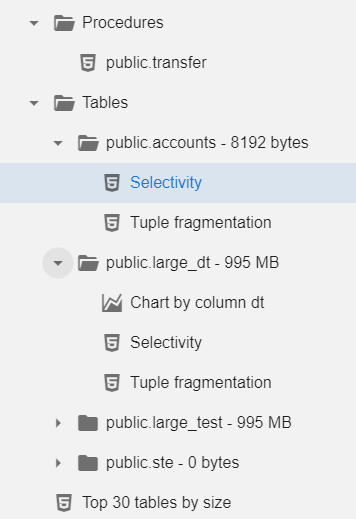
At the top level, you have a few server-wide reports and a list
of databases with their sizes.
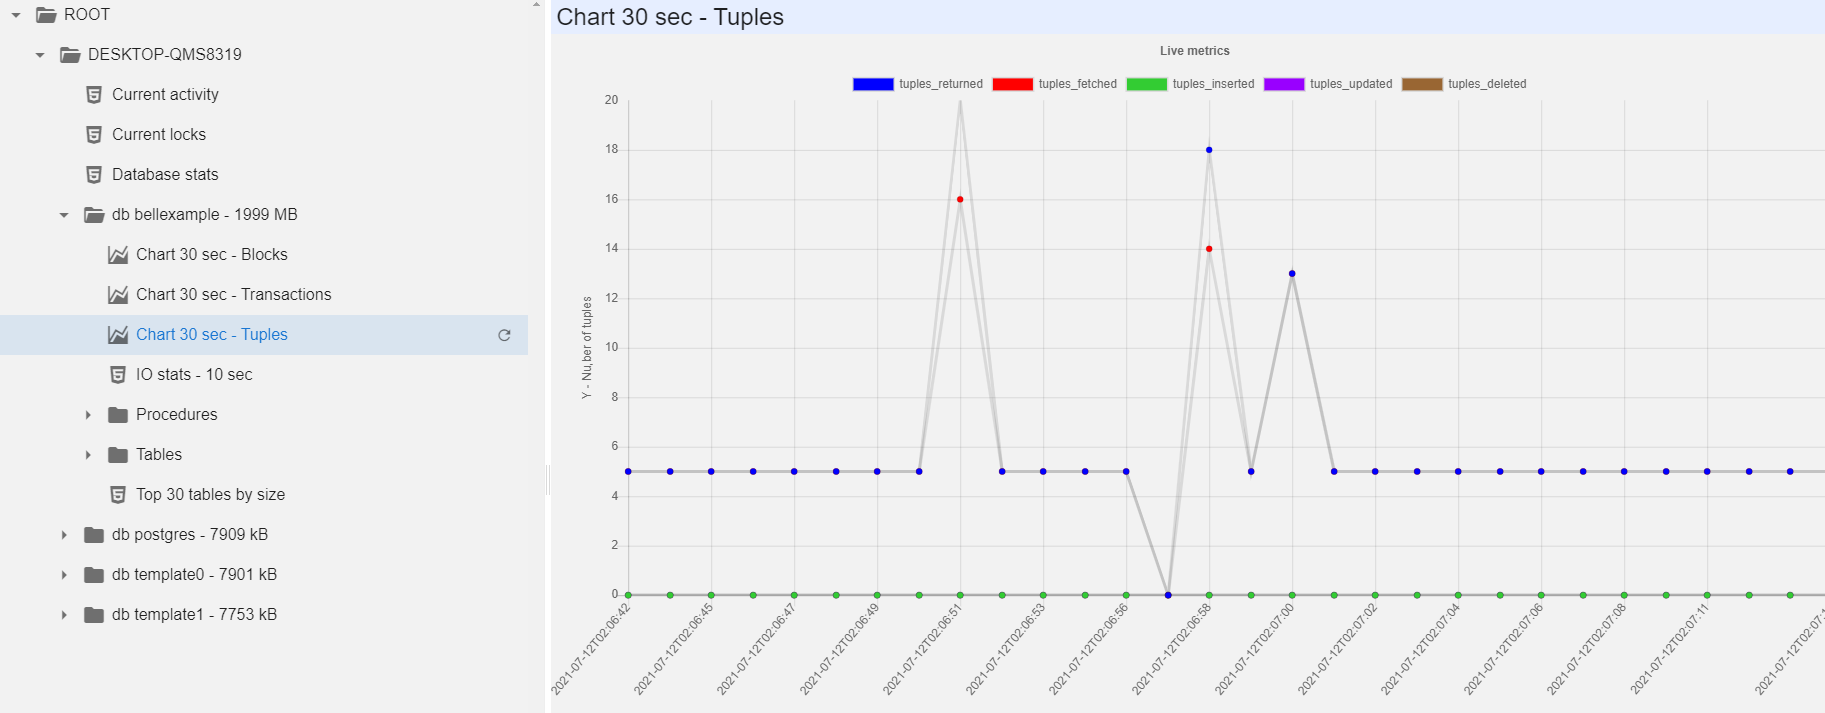
At a database level, you get several performance charts (you have
to wait 30 seconds or 10 seconds for each, the module builds
charts by calculating deltas of the increasing cumulative values)
and the "biggest tables" report.
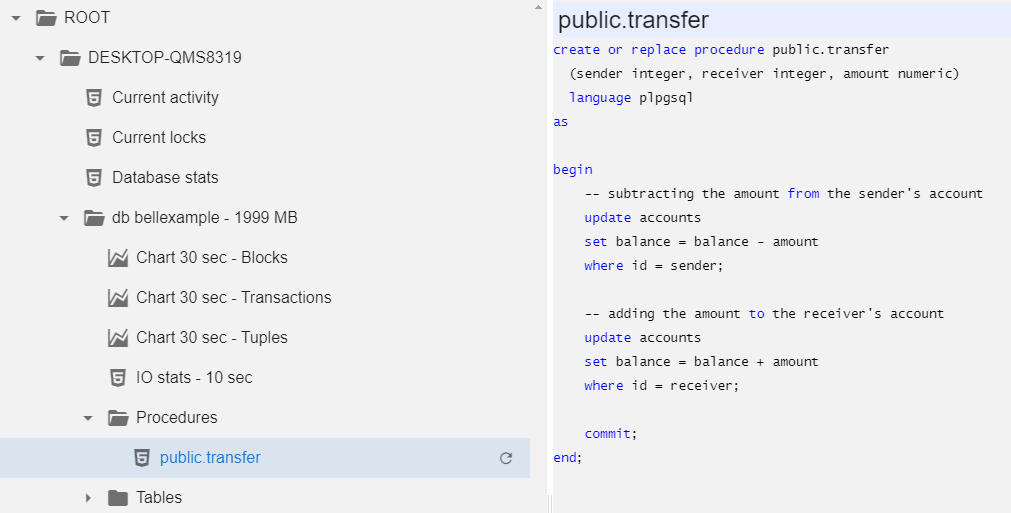
You can click on any stored procedure to inspect the source code:
Finally, for every table you can get fragmentation and selectivity reports, and for tables with datetime columns distribution of the values by date (number of records per date):
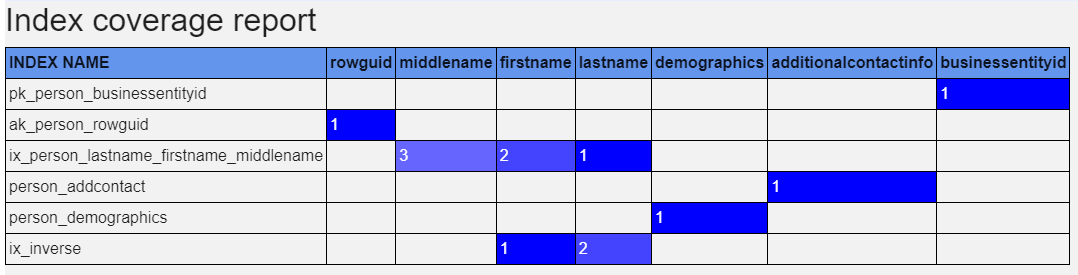
The index coverage report lists all columns, covered by any index at least once. Leading column in an index is marked with '1', second with '2' etc. You can easily spot over-indexing and bad indexing.
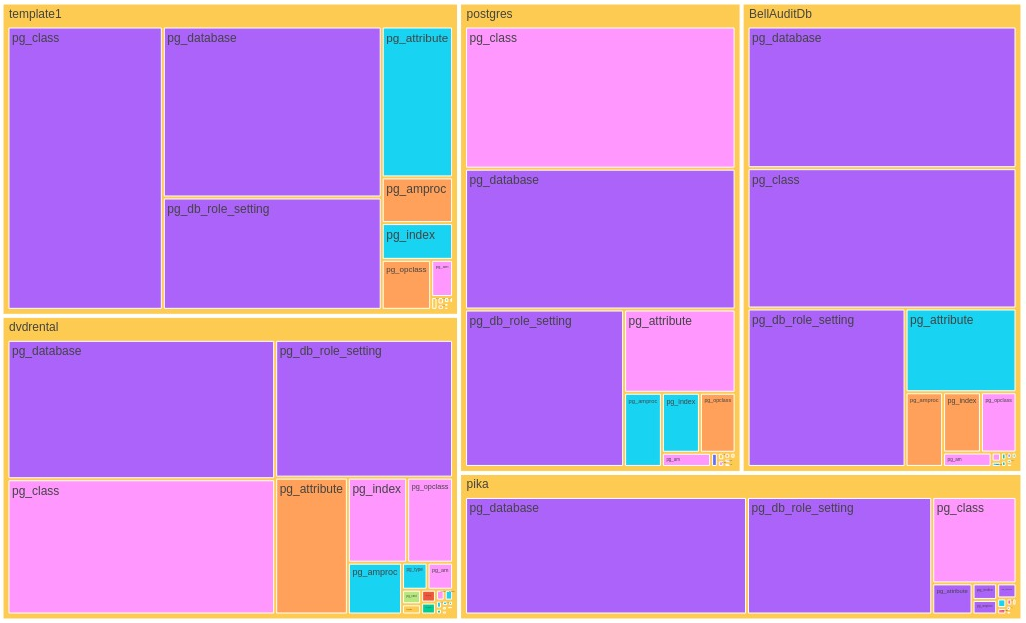
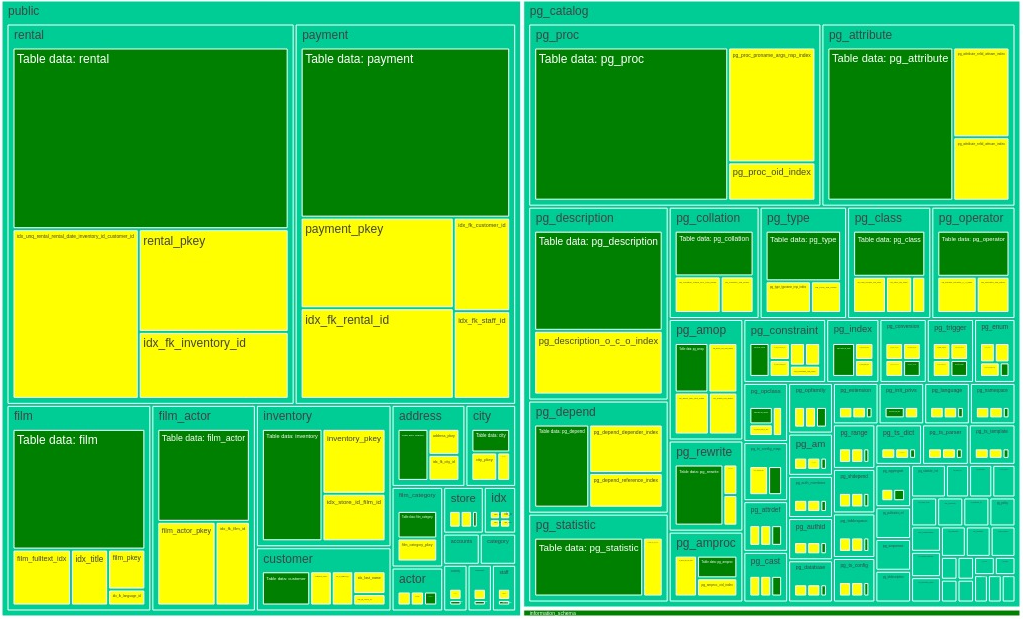
NEW: TreeMap of table and index sizes in every database
and on server at whole.
Color represents:
Green - table data
Yellow - indexes
NEW: TreeMap of table hits in every database and on server
at whole.
Color represents cache hits ratio